了解 Prometheus 的同学都知道,回写(backfill)这个功能出现在最新的 Roadmap 中,它属于一个比较重要的功能。
为什么需要 backfilling?
- 创建新的 record rules 可以填充老数据。
- 方便数据迁移,避免从其它系统迁移到 Prometheus 而丢失老数据。
- 快速构建模拟数据,方便调试 PromQL。
前几天看到 #8084 这个 PR 合并到了主分支,它实现的是 OpenMetrics 格式文本文件导入版本,下面我们一起看看它的用法。
编译最新版本
由于相关功能还没正式发版,所以这里直接编译最新的 master 分支,得到的 Prometheus 和 Promtool 版本如下:由于相关功能还没正式发版,所以这里直接编译最新的 master 分支,得到的 Prometheus 和 Promtool 版本如下:
$ ./prometheus --version
prometheus, version 2.23.0 (branch: master, revision: e13f4a5f6e93c51b0238e2b7095e575e905ad758)
  build user:       songjiayang@ZBMAC-90549ae81
  build date:       20201209-22:31:13
  go version:       go1.14.6
  platform:         darwin/amd64

$ ./promtool --version
promtool, version 2.23.0 (branch: master, revision: e13f4a5f6e93c51b0238e2b7095e575e905ad758)
  build user:       songjiayang@ZBMAC-90549ae81
  build date:       20201209-22:31:13
  go version:       go1.14.6
  platform:         darwin/amd64
新版 promtool 增加了 tsdb create-blocks-from openmetrics 命令,使用说明如下:
tsdb create-blocks-from openmetrics <input file> [<output directory>]
  Import samples from OpenMetrics input and produce TSDB blocks. Please refer to the storage docs for more details.
构建测试数据
新建一个叫做 backfilling.txt 的测试文件,内容如下:
# HELP http_requests_total The total number of HTTP requests.
# TYPE http_requests_total counter
http_requests_total{code="200"} 1021 1607491300.989
http_requests_total{code="200"} 1022 1607491330
http_requests_total{code="200"} 1026 1607491360
http_requests_total{code="200"} 1029 1607491390.989
http_requests_total{code="200"} 1030 1607491420.989
http_requests_total{code="200"} 1032 1607491450
http_requests_total{code="200"} 1033 1607491480
http_requests_total{code="200"} 1038 1607491510
http_requests_total{code="400"} 2 1607491300.989
http_requests_total{code="400"} 2 1607491330
http_requests_total{code="400"} 3 1607491390.989
http_requests_total{code="400"} 3 1607491420.989
http_requests_total{code="400"} 3 1607491450
http_requests_total{code="400"} 4 1607491360.989
http_requests_total{code="400"} 4 1607491480.989
http_requests_total{code="400"} 5 1607491510
# EOF
这个文本内容属于 OpenMetrics 格式,看上去和 Prometheus 的很像,但它有以下特点:
- 包含 prometheus metric 文本格式的内容,例如 HELP、TYPE 关键字以及命名等。
- 每行时序数据最后添加一个时间戳列,类型为浮点数,整数部分为秒,小数3位为毫秒。
- 必须以显示 # EOF 表示内容结束,不然会报类似
getting min and max timestamp: next: expected next entry after timestamp, got "EOF"的错误。
以上测试数据包含了一个 name 为 http_requests_total ,类型为 counter、labelset 为 {code="200"} | {code="400"} 的时序数据,导入数据时间范围为 1607491300 ~ 1607491510。
启动 Prometheus 并导入数据
刚启动 Prometheus 时,data 目录内容如下:
$ tree data

data
├── chunks_head
├── lock
├── queries.active
└── wal
    ├── 00000000
    └── 00000001

2 directories, 4 files
第 1 次执行导入命令:
$ ./promtool tsdb create-blocks-from openmetrics backfilling.txt
BLOCK ULID                  MIN TIME                       MAX TIME                       DURATION   NUM SAMPLES  NUM CHUNKS  NUM SERIES  SIZE
01ES5PNA15GJ9TSKBYX4Y850BW  2020-12-09 05:21:40 +0000 UTC  2020-12-09 05:25:10 +0000 UTC  3m30.001s  15           2           2           769B

$ tree data
data
├── 01ES5PNA15GJ9TSKBYX4Y850BW
│   ├── chunks
│   │   └── 000001
│   ├── index
│   ├── meta.json
│   └── tombstones
├── chunks_head
├── lock
├── queries.active
└── wal
    ├── 00000000
    └── 00000001

4 directories, 8 files
当第 1 次执行完导入命令后,data 目录新增了一个叫做 01ES5PNA15GJ9TSKBYX4Y850BW block,说明我们的数据已经成功导入。
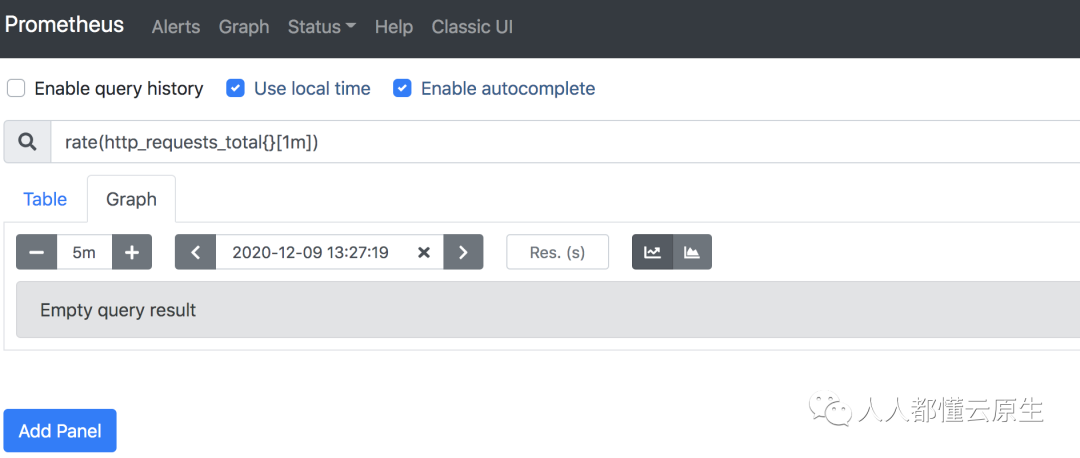
等待大约 1分钟,Prometheus log 没有任何变化,到 Prometheus 的 graph 执行对应查询也没有查询到刚导入的数据。
第 2 次执行导入命令,此时又新增了一个名为 01ES5PYJ29D6YK75E4V3E72WFB 的 block,等待大约 1分钟(tsdb compation 默认时间间隔),可以看到 Prometheus log 中新增了如下内容:
level=warn ts=2020-12-10T06:56:32.485Z caller=compact.go:686 component=tsdb msg="Found overlapping blocks during compaction" ulid=01ES5PZRP848J7AC8PNME78Y2Z
level=info ts=2020-12-10T06:56:33.130Z caller=compact.go:448 component=tsdb msg="compact blocks" count=2 mint=1607491300989 maxt=1607491510990 ulid=01ES5PZRP848J7AC8PNME78Y2Z sources="[01ES5PXXFEKKMDYJEDFJ57JPZ3 01ES5PYJ29D6YK75E4V3E72WFB]" duration=674.437236ms
level=info ts=2020-12-10T06:56:33.155Z caller=db.go:1197 component=tsdb msg="Deleting obsolete block" block=01ES5PYJ29D6YK75E4V3E72WFB
level=info ts=2020-12-10T06:56:33.166Z caller=db.go:1197 component=tsdb msg="Deleting obsolete block" block=01ES5PXXFEKKMDYJEDFJ57JPZ3
日志内容表明,当第 2 次执行完导入命令后,产生了有时间重叠的多个 block,Prometheus 启动压实,压实完成后会产生一个新的 block,并且被 Prometheus 感知到,故此时相同查询可以得到导入数据。
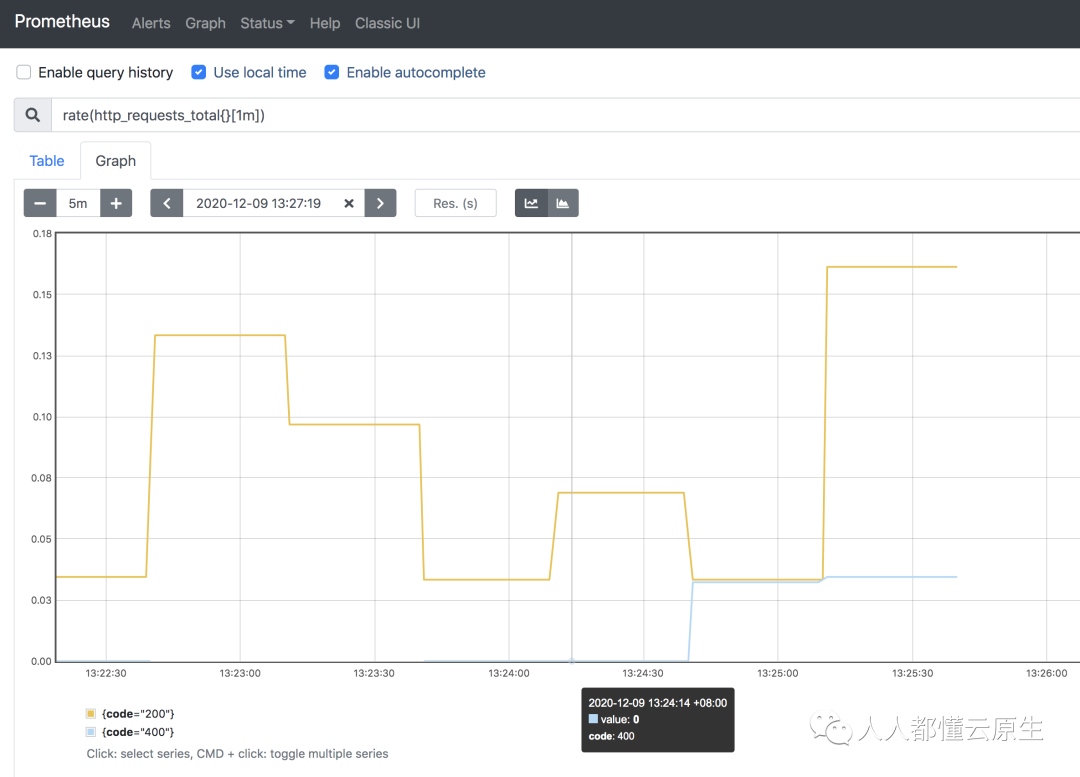
关于这一点,我觉得是一个 bug,理论新增的 block 无论是否有时间重叠都应该被查询到,立马给官方提了一个 issue #8268,欢迎大家关注。
总结
今天我们手动编译了最新版本的 prometheus 和 promtool,然后通过最新的 promtool 的 tsdb create-blocks-from openmetrics 命令成功导入了历史数据,需要注意的是导入数据的 openmetrics 格式文件需要显示添加 # EOF。
当导入成功后,如果新增的 block 的时间范围和已经存在的 block 时间没有重叠,Prometheus 不会执行压实任务,从而新导入的数据不会被 Prometheus 感知到。目前可以通过手动多次运行导入命令的方式来解决,对此我提交了一个相应的 issue,希望这个 bug 在不久的将来会被修复。
参考资料:
- https://grafana.com/go/observabilitycon/the-evolution-of-prometheus-observability/
- https://github.com/prometheus/prometheus/projects/1