以前我们介绍过, Mimir 想成为大一统的时序数据库,对多种数据协议的写入原生支持(不再需要 Proxy)必不可少,它除了天然支持 Prometheus、OpenMetrics 外,终于在 v2.3.0 实现了对 OTLP 的支持,这离它宣传兼容主流协议又近了一步。
OTLP metric 是 OpenTelemetry 提供的指标格式,具体可以参考 specification/metrics, 而 Mimir 目前支持的是 OTLP/HTTP 模式,gRPC 暂不支持。
下面我们就以一个最简单 Go Web 服务进行讲解其使用。
简单示例
Go Web 程序
这里我们使用 Go 微服务框架,实现一个简单的 /users/:id API 接口。
r := gin.New()
r.GET("/users/:id", func(ctx *gin.Context) {
    id := ctx.Param("id")
    // 模拟随机延迟
    if rand.Intn(100) < 10 {
        time.Sleep(200 * time.Millisecond)
    }

    ctx.JSON(200, gin.H{
        "id": id,
    })
})
r.Run(":8080")
OpenTelemetry 集成
新建 timeDuration middleware
首先我们使用 OpenTelemetry metric/global 包,定义了一个叫做 http_durations_histogram_seconds 的 histogram 指标用于 timeDuration middleware 每次请求的延迟统计。
func timeDuration() func(ctx *gin.Context) {
  meter := global.Meter("gin-otlp-meter")
  httpDurationsHistogram, _ := meter.SyncFloat64().Histogram(
    "http_durations_histogram_seconds",
    instrument.WithDescription("Http latency distributions."),
  )

  return func(ctx *gin.Context) {
    start := time.Now()
    ctx.Next()
    status := strconv.Itoa(ctx.Writer.Status())
    method := ctx.Request.Method
    elapsed := float64(time.Since(start)) / float64(time.Second)
    httpDurationsHistogram.Record(
      ctx,
      elapsed,
      attribute.String("method", method),
      attribute.String("status", status),
    )
  }
}
使用 OTLP/HTTP 进行指标导出
这里我们直接导出到 Mimir 的 OTLP/HTTP 地址(/otlp/v1/metrics),并设置 15s 推送间隔。
func initMeter() (*controller.Controller, error) {
  ep, err := otlpmetrichttp.New(
    context.Background(),
    otlpmetrichttp.WithEndpoint("mimir:8080"),
    otlpmetrichttp.WithURLPath("/otlp/v1/metrics"),
    otlpmetrichttp.WithInsecure(),
    otlpmetrichttp.WithHeaders(map[string]string{
      "X-Scope-OrgID": "demo", // 注入 Mimir 租户信息
    }),
  )
  if err != nil {
    return nil, err
  }

  c := controller.New(
    processor.NewFactory(
      simple.NewWithHistogramDistribution(
        histogram.WithExplicitBoundaries([]float64{0.05, 0.1, 0.25, 0.5, 1, 2}),
      ),
      aggregation.CumulativeTemporalitySelector(),
      processor.WithMemory(true),
    ),
    controller.WithExporter(ep),
    controller.WithCollectPeriod(15*time.Second),
  )

  global.SetMeterProvider(c)

  return c, c.Start(context.Background())
}
程序运行
示例程序 Dockerfile 如下:
FROM golang:alpine AS builder
WORKDIR /build
ADD go.mod .
COPY . .
RUN GOPROXY=off go build -o app -mod=vendor main.go

FROM alpine
WORKDIR /app
COPY --from=builder /build/app /app/app
CMD ["./app"]
整个测试 docker-compose.yml 内容大致为:
version: '3.3'
services:
  mimir-otlp:
    image: songjiayang/mimir-otlp:0.0.1
    depends_on:
      - mimir
    ports:
      - "8080:8080"
  mimir:
    image: grafana/mimir:2.3.0-rc.1
    command: ["-config.file=/etc/mimir.yaml"]
    hostname: mimir
    depends_on:
      - minio
    volumes:
      - ./etc/mimir.yaml:/etc/mimir.yaml
      - mimir-data:/data
大家如果想体验完整程序,可以 git clone https://github.com/grafanafans/mimir-otlp.git 到本地,然后执行 docker-compose up -d 。
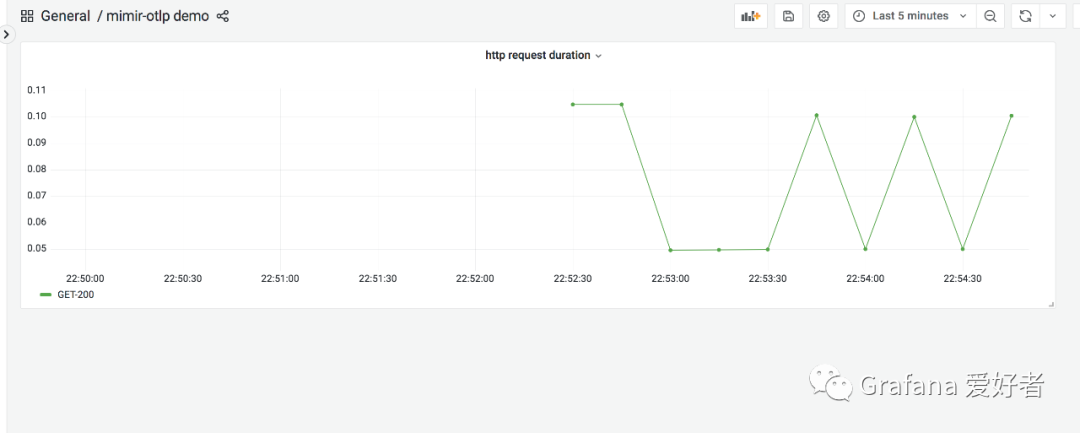
最后使用 wrk -d 1m http://localhost:8080/users/1 进行数据注入,访问 http://localhost:3000 查看默认的 Grafana 看板,即可看到刚上报到 Mimir 的指标数据。
总结
在 OTLP 支持之前,要将指标数据写入 Mimir,需要程序以 Prometheus exporter 进行导出或经过 OpenTelemetry collector 收集后再以 prometheusremotewrite 进行导出,在当今 OpenTelemetry 越发成为主流的情况下,业务侧需要理解两套协议,增加了心智负担。
而 Mimir 原生支持 OTLP 协议后,我们可以使用 OpenTelemetry SDK 统一导出为 OTLP,后面无论推送到 Mimir ,还是经过 collector 进行 OTLP 的转发,应用侧始终只有一种数据格式。