系列文章第2篇中我们讲到,基于SLO告警最好采用 MWMR(多窗口多燃烧率)的策略。所以当我们以 Prometheus 为基础,实现 MWMR SLO 告警时需注意以下几点:
- 时间窗口、燃烧率、告警级别需要同时考虑。
- 单个 SLO 会同时生成多个 Prometheus record 和 alert 规则。
- 时间窗口、燃烧率、告警级别任一更改需要重新生成告警规则。
大量 Prometheus 规则文件的生成并不容易,那我们该如何准确、高效的生成它们呢?
今天要向大家推荐的一个 Prometheus SLO 生成器 – sloth。
Sloth 简介
Sloth 是 GitHub 上一个开源的 Prometheus SLO 自动生成器,它采用 MWMR 的策略,支持窗口和多个告警策略的配置,以及 SLI 插件来简化 SLO 编写;另外它打通了 Prometheus-Operator ,并提供开箱即用的 Grafana 模板,实现多服务 SLO 可视化的统一。
SLoth 整体架构
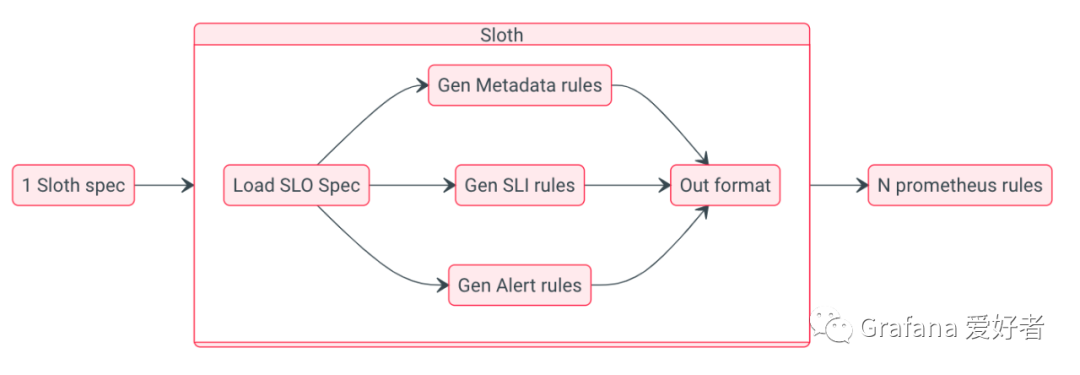
从架构图可知,sloth 统一加载 SLO 配置后,会将其自动转化为 SLIs, Metadata, Alerts 三类 Prometheus 规则:
- SLIs: 属于 Prometheus record 类型,它是一切 SLO 计算的基础,根据用户配置的 events,自动生成不同时间窗口的指标错误率(例如slo:sli_error:ratio_rate5m,slo:sli_error:ratio_rate30m)。
- Metadata: 属于 Prometheus record 类型,主要用于某个服务 SLO 使用情况统计,如剩余错误预算、SLO 目标百分比,这些指标用于 SLO 可视化非常方便。
- Alerts: 属于 Prometheus alert 类型,它依靠生成的 SLIs,结合不同窗口配置参数生成不同级别的告警规则。
Sloth 支持的 SLO 三种格式
Sloth 一共支持三种不同 SLO 格式,它们分别为默认、K8s、OpenSLO。
- 默认格式
version: "prometheus/v1"
service: "myservice"
labels:
  owner: "myteam"
slos:
  - name: "requests-availability"
    objective: 99.9
    description: "Common SLO based on availability for HTTP request responses."
    sli:
      events:
        error_query: sum(rate(http_request_duration_seconds_count{job="myservice",code=~"(5..|429)"}[]))
        total_query: sum(rate(http_request_duration_seconds_count{job="myservice"}[]))
    alerting:
      ...
它是 sloth 自定义的格式,主要包含了服务名称、服务标签和多个 SLos 配置,非 K8S 环境大多采用它。
- K8s 格式
apiVersion: sloth.slok.dev/v1
kind: PrometheusServiceLevel
metadata:
  name: sloth-slo-my-service
  namespace: monitoring
spec:
  service: "myservice"
  labels:
  owner: "myteam"
  slos:
    - name: "requests-availability"
        objective: 99.9
        description: "Common SLO based on availability for HTTP request responses."
        sli:
        events:
            error_query: sum(rate(http_request_duration_seconds_count{job="myservice",code=~"(5..|429)"}[]))
            total_query: sum(rate(http_request_duration_seconds_count{job="myservice"}[]))
        alerting:
        ...
它其实是一个叫做 PrometheusServiceLevel 的 K8s CRD,其 spec 内容与 sloth 默认格式基本一致。
Sloth 不仅支持 CLI 还支持 K8s controller,当它监听到 K8s 集群的 PrometheusServiceLevel 资源对象的变更,会自动将其转化为 Prometheus Operator 的 PrometheusRule 资源对象,做到 Prometheus Operator 无缝对接。
- OpenSLO 格式:
apiVersion: openslo/v1alpha
kind: SLO
metadata:
  name: sloth-slo-my-service
  displayName: Requests Availability
spec:
  service: my-service
  description: "Common SLO based on availability for HTTP request responses."
  budgetingMethod: Occurrences
  objectives:
    - ratioMetrics:
        good:
          source: prometheus
          queryType: promql
          query: sum(rate(http_request_duration_seconds_count{job="myservice",code!~"(5..|429)"}[]))
        total:
          source: prometheus
          queryType: promql
          query: sum(rate(http_request_duration_seconds_count{job="myservice"}[]))
      target: 0.999
  timeWindows:
    - count: 30
      unit: Day
社区为了更好推进 SLO 落地和应用,发起了 OpenSLO 项目,它支持多种数据源(不仅限于 Prometheus),所以 sloth 也对其进行了部分支持。
安装和使用
二进制安装和使用
curl https://github.com/slok/sloth/releases/download/v0.11.0/sloth-linux-amd64 -o sloth
chmod +x sloth
./sloth generate -i slos/myservice.yaml -o rules/myservice.yaml
国内从 github 下载资源较慢,大家可以使用容器进行安装。
Docker 安装和使用
# 如果 ghcr.io 镜像无法拉取,请使用 ghcr.dockerproxy.com 代理
docker pull ghcr.io/slok/sloth
docker run --rm --name sloth -v=$(pwd):/sloth ghcr.io/slok/sloth generate -i /sloth/slos/myservice.yaml -o /sloth/rules/myservice.yaml
K8s 安装和使用
curl https://raw.githubusercontent.com/slok/sloth/v0.11.0/pkg/kubernetes/gen/crd/sloth.slok.dev_prometheusservicelevels.yaml -o sloth.slok.dev_prometheusservicelevels.yaml
kubectl apply -f sloth.slok.dev_prometheusservicelevels.yaml

curl https://raw.githubusercontent.com/slok/sloth/main/deploy/kubernetes/raw/sloth.yaml -o sloth.yaml

$ kubectl create ns monitoring
#  运行 sloth controller
$ kubectl apply -f deploy/kubernetes/raw/sloth.yaml

# 部署 slo
$ kubectl apply -f examples/k8s-getting-started.yml
Helm 安装
helm repo add sloth https://slok.github.io/sloth
helm repo update
helm template sloth/sloth --include-crds

# 部署 slo
$ kubectl apply -f ./examples/k8s-getting-started.yml
实战练习
示例流程
整个流程如下图:
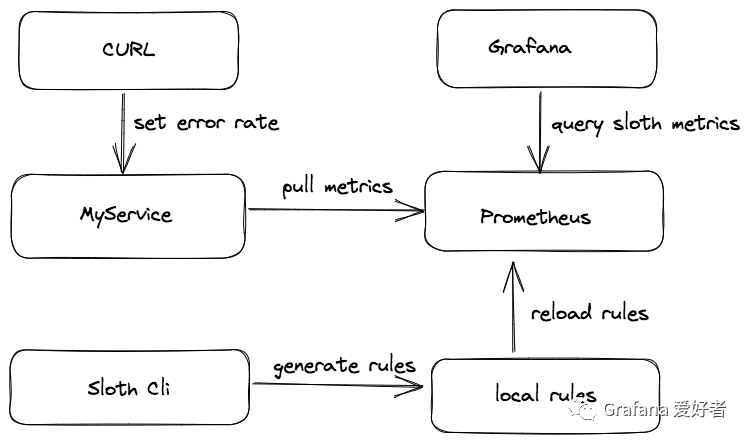
流程说明:
- 使用 sloth cli 自动生成 SLO 相关的规则文件。
- 创建一个叫做 MyService 的 HTTP 服务,该服务通过暴露的接口可以设置不同错误预算消耗率。
- 部署 Prometheus 收集 MyService 的指标,并加载 sloth 自动生成的 rules 配置文件。
- Grafana 通过导入 sloth 预设的模版,进行 MyService SLO 的可视化。
程序运行及效果
示例程序已提交到 https://github.com/grafanafans/play-with-sloth 仓库,欢迎查看。
- 启动程序
git clone https://github.com/grafanafans/play-with-sloth.git
make generate // 使用 sloth cli 生成 myservice 的 rules
make start
- Grafana 导入 sloth 看板
使用导入创建的方式新增 slos 相关看板,导入的看板 id 为 14348 和 14643。
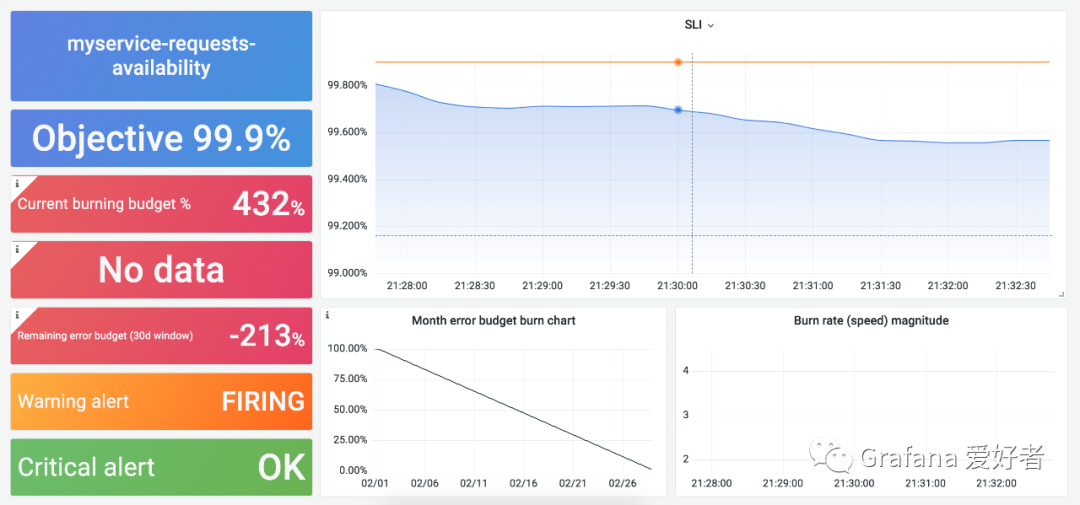
- 设置 MyService 错误率
curl http://localhost:8080/errrate?value=0.005
当设置错误率为 0.5%(SLO 0.1%的5倍),其看板内容大致为:
总结
本文主要讲解如何围绕 sloth 进行 SLO 建设,使用它不仅可以高效生成大量 Prometheus rules 配置文件,还可以通过开箱即用的统一看板对多个服务的 SLO 进行观测。另外 sloth 提供的 K8s controller 能够与 Prometheus Operator 无缝对接,更加方便云原生用户使用,感兴趣的小伙伴可以试试。