我们经常被问到:“你服务运行的质量如何?“
问题很简单,几个字,但想要回答好并不容易,因为你需要有明确的数据来支持你的结论。
那我们该如何量化我们的服务呢?
使用 USE 方法
通常我们使用 USE 方法来量化我们的硬件资源使用情况,它具体指:
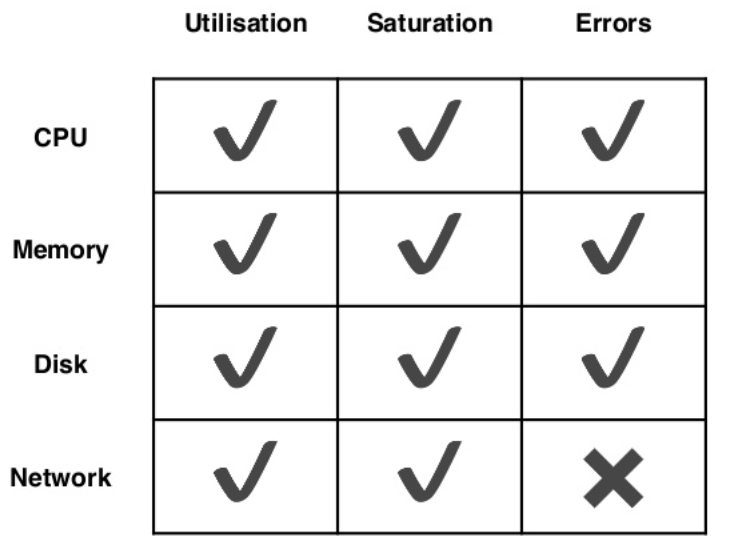
- Utilisation: % time that the resource was busy
- Saturation: amount of work resource has to do, often queue length
- Errors: the count of error events
我们的硬件资源常见检测项包括:
我们来看看一个 Prometheus 关于内存查询的例子:
内存使用率(Utilisation):
1 - sum( node_memory_MemFree{job=“…”} +
  node_memory_Cached{job=“…”} +
  node_memory_Buffers{job=“…”})
  / sum(node_memory_MemTotal{job=“…”})
内存饱和(Saturation):
1e3 * sum(
  rate(node_vmstat_pgpgin{job=“…”}[1m]) +
  rate(node_vmstat_pgpgout{job=“…”}[1m]))
)
使用 RED 方法
通常我们使用 RED 方法来量化我们后端服务的运行情况(尤其微服务),它具体指:
- Rate: number of requests per second
- Errors: the number of those requests that are failing
- Duration: the amount of time those requests take
使用 Prometheus 查询例子:
// rate:
sum(rate(request_duration_seconds_count{job=“…”}[1m]))
// errors:
sum(rate(request_duration_seconds_count{job=“…”,
  status_code!~”2..”}[1m]))
// duration:
histogram_quantile(0.99,
  sum(rate(request_duration_seconds_bucket{job=“…}[1m])) by (le))
Google SRE 4 黄金指标
- Latency: time taken to serve a request
- Traffic: how much demand is places on your system
- Errors: rate or requests that are failing
- Saturation: how “full” your services is
对于 Google SRE 的指标是很多公司参考和努力的方向,不过通常我们可以将它简化为 RED 方法。